I started to write articles on the wiki of Sec IT’s related to the posts on this blog. Here is the first one. If you want to modify or improve the article (I’m pretty sure there are plenty of typos and materials to describe), feel free to edit it on the wiki.
Wireshark is a free and open-source packet analyzer. It is used for network troubleshooting, analysis, software and communications protocol development, and education. Originally named Ethereal, in May 2006 the project was renamed Wireshark due to trademark issues.
Wireshark is cross-platform, it runs on various Unix-like operating systems including Linux, Mac OS X, BSD, and Solaris, and on Microsoft Windows. There is also a terminal-based (non-GUI) version called TShark. Wireshark, and the other programs distributed with it such as TShark, are free software, released under the terms of the GNU General Public License.
Installation
The Wireshark install package for Windows and OS X together with its source code is available on the official download page. For Linux distribution based on Debian (like Ubuntu), Wireshark is available with aptitude:
sudo apt-get install wireshark
Usage
Capturing packets
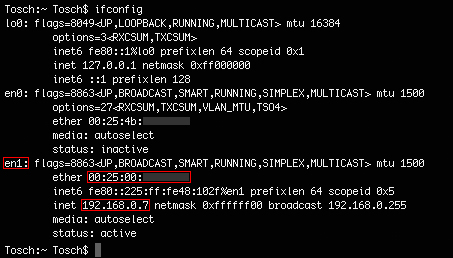
Before analysing the communication, you need to capture the traffic. The first step is to determine which communication to sniff. Your computer uses one or more interfaces to communicate over networks. For instance the wireless communication uses a different interface than the Ethernet (wired) communication. If you know the IP address of the network you want to sniff, you can use the terminal to list the interfaces and get information about them like the MAC address and the IP address assigned to them:
- On Unix-like (OS X, Ubuntu, etc.), open the terminal and type: ifconfig
- On Windows, go in the ”Start” menu, selection execute then type: ipconfig
The picture shows the output of ifconfig on a MacBook (Mac OS X v. 10.7.2). You can see that the wifi interface (en1) with its MAC address starting with the 3 bytes 00:25:00 has been assigned the IP address: 192.168.0.7. If you want to sniff the traffic from the network 192.168.0.0, you have to capture the packet from the interface ”en1”.
Now you determined the interface to use for capturing packets, you can run Wireshark then list the interfaces with the menu Capture > Interfaces… (Ctrl+i) or via the button “List the available capture interfaces…”
A new window will open, listing all available interfaces for capturing packets. You can see on the screenshot below a list of four interfaces including the Ethernet (en0) and the wireless (en1) interface. The list gives the IP address assigned to the interface (in IPv6 on this picture, but you can toggle in IPv4 by clicking the IP address), the number of packets sent and received on the interface since the window has been opened and the number of packets per second in live. These last two details might also be used to determine which interface to use for sniffing regarding the amount of transmitted packets.
There are two buttons per interface: “Start” and “Options”. “Start” will start capturing packets, while “Options” will open a new window for configuring the capture of packets.
Analysing the packets
Once the capture of packets started, you can see all the packets passing through the interface selected in the main frame of Wireshark. The packets are listed in a table with 7 columns:
- No.: Each packet has an identification number corresponding to the order in which it has been captured.
- Time: It is the time in second when the packet has been captured from the beginning of the capture.
- Source: The source address of the packet.
- Destination: The destination address of the packet.
- Protocol: The protocol used by the packet.
- Length: The packet length (in bytes).
- Info: It gives more information about the packet.
To get further information, select a packet. In the frame below the list, you will see the packet structured in different layers (data link, network, transport, etc.). You can read the content of the headers of each protocol layer and the content of the payload by clicking on the arrow to scroll the information.
Filtering the packets
It might be complicated to find the packets you want to analyse among all those captured on the interface. This is why Wireshark has a filter system implemented. There are several filters already set when you click on “Expression…” next to the filter field, but it is also possible to build your own filter. Here are a few useful options:
- ip.src: filter the IP source. Example: ip.src==192.168.0.7 will output only the packets with the IP source 192.168.0.7. ip.src==192.168.0.0/24 will output packets with the IP source from the network 192.168.0.0 with the mask 255.255.255.0.
- ip.dst: same as ip.src but for the destination IP.
- tcp.port: filter the port. Example: tcp.port==80 will output only the packets sent on the port TCP 80.
- udp.port: same as tcp.port but for the protocol UDP.
You can also write the protocol name to output only the packet using a specific protocol. It is also possible to combine two or more filters with && (which means “and”) or || (which means “or”)
Links
Here is a list of interesting links about Wireshark:


Posted on January 21, 2012
0